Introduction to Statistical Control
Today,
manufacturing companies face increasing competition due to raw material cost
and other factors like employees and resources. Therefore companies must
concentrate on strategies to improve their level to come best in the market.
Companies must try for continuous improvement in quality, efficiency and cost
reduction. Many companies still rely on inspection after production for quality
analysis. In recent trends, many control methods has come into existence which
would increase the product quality.
Control
plays a major part in every industry for the betterment of the process and the
quality. For this purpose, statistical approach is used in many organizations.
In statistics, controlling a variable attempts to reduce the effect of other
variables i.e., it is an observational study effect of one variable is measured
while all other variables are kept constant.For statistical control in research,
during experiments, researchers assign variables randomly to the treatment group
such that the variables are not interchanged and hence their effects are
observed independently, and the defects are found out easily if there occurs a
malfunction in the process.
There
are several mechanisms for the process control and quality control. Statistical quality
control refers, to the usage of statistical method that helps in monitoring and
maintaining the quality of products and services. Acceptance sampling method
and rejection method is followed based on the quality test conducted during
testing method.
Statistical Process Control (SPC)
On
the other hand, Process control is a discipline that deals with architectures,
mechanisms and algorithms in order to obtain an output for the desired range.
It is extensively used in industry in various parts of departments such as
power plants, manufacturing, production, Manufacturing and so on. It enables
automation and thus reduces human errors and wastage of resources.
Statistical process control is a processcontrol method that uses statistical
methods to monitor and control a process to ensure that the process operates at
its full potential.
SPC
is used to reduce the process waste and to eliminate the step-by-step
manufacture inspection. The concept of SPC was brought out by Walter A.
Shewhart in early 1920s along with control chart for understanding the process
and specification limits, eliminating assignable sources of variation and
monitoring the ongoing production products.
Statistical Process Control (SPC) is a branch of statistics that combines time series analysis methods with graphical representation of data and thus helps to take a deep insight on data more quickly and in fast decision-making. Although SPC was introduced in the early before the six sigma approach it is still one of the most advantageous methods used in most of the organizations. SPC data is collected in the form of measurements of a product dimension or future or readings. The data is then recorded and tracked on various types of control charts. The data can be in the form of continuous variable or average.
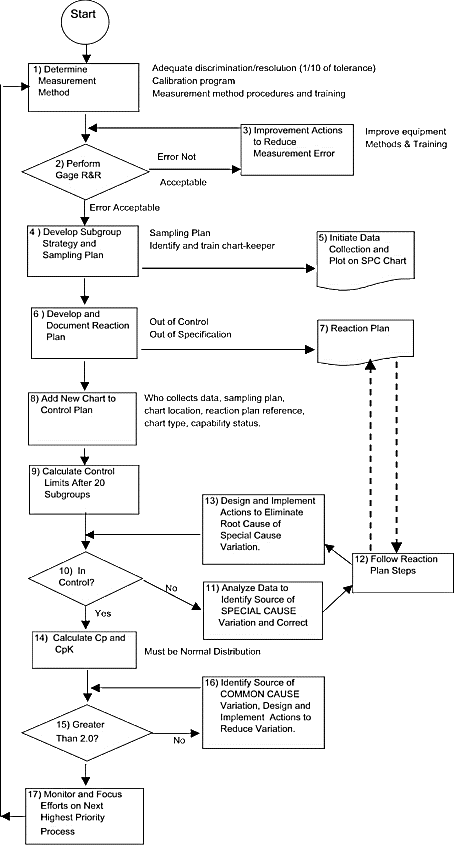
Fig.1-SPC
plan implementation It
helps in ensuring whether the process is stable or not. An example for the
process where SPC is applied is in the manufacturing lines. In industries,
those who manufacture on large-scale experience confusions and conflicts during
the process and the quality measurement. And as the reputation mainly depends
on the quality, these control method are quite useful and easy to be
implemented by the organization. It is more common in the manufacturing industries
and in organizations which operate in multiple streams like manufacturing,
production, testing and delivery. SPC
seeks to measure the quality of work in process, and its implementation is
typically the first step towards total quality systems management. It is useful
process improvement technique in getting and keeping a process on target with
minimal variation. SPC emphasizes early detection and
prevention of problems, which can benefit to production of quality products and
hence time plays a major constraint in implementing SPC. SPC is cost-effective
as if the process changes, it leads to the wastage of the resources. Another
major problem in implementing SPC is the misunderstanding of the real concept
of SPC.
Control Charts
Fig.2-Example
of SPC Chart
The control chart changes according to the process and the outputs obtained in
each and every process. A control chart is used to keep the process and quality
under control. A control chart has a central line for the average, an upper
line for the upper control limit and a lower line for the lower control limit.
These lines are determined from historical data. The analysis of control chart
indicates whether the process is under control or not. If not stable, the
precautionary measures to make it stable can be taken. It is one of the seven
basic tools of quality control.
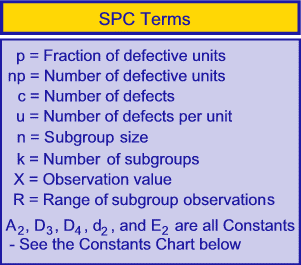
Fig.4-terms
used in Control Chart Control
charts consists of control limits which are known as Tolerance limits of
the sample series. Control limits are used for the mean and mean variation of a
series. One of the most commonly used control chart for variable data is X bar
and R chart. X bar represents the average and it displays the variation in the
sample data collected. Once the chart is set up, the operator will measure
multiple samples and calculate the average. This value is recorded and depicted
in the chart. Control
chart reveals the factors like variations in material properties, seasonal changes in temperature or humidity,
normal machine or tear, normal measurement variation. It also includes special
cause variation such as process shift, machine malfunction, broken tool and
inexperienced operator. These changes should be identified and corrective
actions should be taken. Contents of Control Chart
The control chart uses various parameters such as normal distribution, mean,
and standard deviation for the measurement of the variables by which the
efficiency is determined. Normal distribution is defined as the
heart of SPC as its typical Gaussian distribution curve les in the heart of the
mathematical model that illustrates statistical process control. Normal
distribution is based on principle of limitless totality.
Fig.5-Points
on a SPC chart The
chart may also contain warning and control limits
depending upon our needs. The purpose of control charts is to allow simple
detection of events that indicate the actual process change. SPC is used as a
real time method implementation in various organizations and baldor is one of
the examples for it.
Application Baldor is one of the organizations that implement SPC on the
ongoing process in the management. It is one of the leading producers of
industrial electric motors, power transmission products and generators. At
baldor, the management believes in product quality as much as production
quantity to ensure the level of quality baldor decided to institute a policy
dedicated to consumer satisfaction and this policy was entirely based on
statistical process control. The management reveals that this solution is user
friendly for production and was quickly adopted by their employees. SPC was
instituted into baldor, a corporate culture with quality personnel, engineers
and managers all using data to improve processors. After
the implementation of SPC, baldor evaluated the successful SPC techniques and
founded the user-friendly interface and better inspection tools and methods.
The methods produced faster, more accurate inspections with reduced cost. These
savings eliminated the handwritten charts and log books with control charts.
As, a result of this implementation, baldor was able to measure improvement in quality throughout the manufacturing
process.They reported 66% annual dollar savings while others reported only 63%
annual dollar savings. Baldor’s customers are on the winning end of quality
improvement and reported 48% reduction in warranty claims.
Conclusion Recently,
an infinity QSProFicient software with SPC was developed that can detect
production errors as it occurs and such that it alerts you before it is too
late. It allows data to stream in real-time to a central quality control hub.
With this real time data you will be able to alter specific aspects of your
production. This
will increase efficiency and provide maximum control over process and quality.
SPC Software is the tool that will allow this process to take place. It reduces
the monthly reports and the software provides fast
and accurate comfort so that take holders can confidently move forward with
organizations plans without any confusions. Hence, SPC has been proven as a
best solution for the upcoming challenges in the field of business. More
Readings


 USA
USA  India
India