A finite subset of statistical
individuals in a population is called a sample and the number of individuals in
a sample is called sample size.
In
a shop we assess the quality of sugar, wheat or any other commodity by taking a
handful of it from the bag and then decide to purchase it or not. On examining
the sample of a particular stuff we arrive at a decision of purchasing or
rejecting that stuff. The error involved in such approximation is known as sampling
error.
In
a statistical investigation the interest usually lies in the assessment of the
general magnitude and the study of variation with respect to one or more
characteristics relating to individuals belonging to a group. This group of
individuals under study is called population.
If
we want to have an idea of the average per capita income of the people in
Canada, we will have to enumerate all the earning individuals in the country,
which is rather a very difficult task.
Sampling Distribution
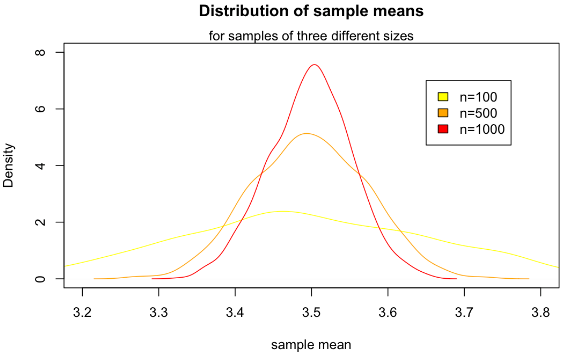
The number of possible samples of size n that can be drawn from a finite population of size N is NCn. if N is large or infinite then we can draw a large number of such samples. For each of these samples we can compute a statistics, say ‘t’….., e.g. mean, variance, etc., which will obviously vary from sample to sample. The aggregate of the various values of the statistics under consideration so obtained may be grouped into a frequency distribution which is known as the sampling distribution of the statistics. Thus we can have the sampling distribution of the sample mean and sample variance etc.
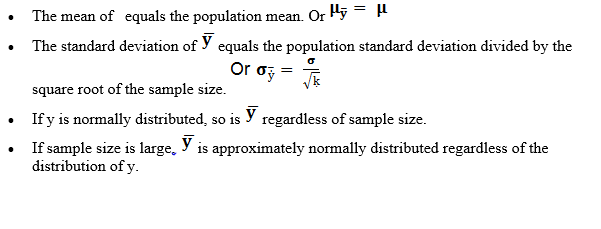
Mean of the Sample Mean: There is simple relationship between
the mean of the variable and the mean of the variable under consideration: They
are equal or in other words for any particular sample size, the mean of all
possible sample means equal the population mean. The equality holds regardless
of the size of the sample. ”For samples of size k, the mean of
the variable equals the mean of the variable under consideration. In symbols,”
Standard Deviation of the Sample Mean
Example The mean living space for single
family detached homes is 1742 sq. ft. Assume a standard deviation of 568 sq.
ft. For sample of 25 single family detached homes, determine the mean and
standard deviation of the sample mean. We have, Standard deviation = 568/5 = 113.6 Hence, for a sample of 25, the mean
and standard deviation of the sample mean is 1742 sq. ft. and 113.6 sq. ft.
respectively. Sampling Distribution of Sample Mean
Solution: Using equation (i) and (ii)
Estimating Population Meanð σ is known
Assumptions:
- The sample is simple random sample (equal chances of
being selected).
- The value of the population standard deviation is
known.
- Either or both of these conditions are satisfied: The
population is normally distributed or k > 30.
- The sample is simple random sample (equal chances of
being selected).

Estimating Population Mean σ is Unknown
Assumptions
- The sample is a simple random sample.
- Either a sample is from a normally distributed
population or k > 30
- The sample is a simple random sample.


 USA
USA  India
India