Introduction to Change Point
This
article gives a basic information regarding
the change points that occur in excel and in other files. We propose the
detection methods for these change points and they are analyzed with a real
time example. The features and applications of the change point are also
discussed later.
Definition of Change Point
In
the statistical studies, the Change Point Detection is known as a Stochastic
Process, which is used to identify the timely changes according to changes
in any one of these parameters- when the probability distribution of the system
changes or when the time series of the system changes. It deals with the
problems that are relating to determining or with detecting whether the time
change has occurred or not and if occurred, it determines the time limit during
which the change has occurred. The change detection is sometimes also referred
to as the anomaly detection, as it
deals with the different detection techniques like step and edge value
detection, that are connected to or in coherence with the changes which occur
in the values like mean, median, variance and covariance.
The
analysis of online changes is one of the most widely used technique in present
day, which is carried out using the sequential or steep by step analysis and
hence is referred to as streaming
algorithm. In Online Detection,
it is used to measure the change that is made using the relation and
association between the metrics like detection delay, false alarm rate and
misdetection rate. There are various types of change detection techniques like:
As the name suggests, the objective
of this Minimax change detection technique is to reduce the delay that is
expected to take place in a system. In some worst-cases that can occur during the
time distribution, this Detection Technique is carried out by CUSUM
procedure which is one of the most popular techniques.
Offline Change Detection
This
detection method was found out by Basseville.
It observes the change in mean detection of the system. This estimation is
related to the EM algorithm method and other related methods like two-phase
regression, clustering and in the maximum likelihood estimation of the system
variables.
This type of detection method deals
with the ability to detect the word-level changes or changes in language
that occur in the presentations of the same sentence.
Change Point Detection Packages
Many
R community packages have been developed for the change point detection. They
already exist in the CRAN and focus effectively on the change point detection.
Let us discuss some of the popular change point software:
CPM:
The
CPM method is used in order to identify or detect the changes in the parametric
and non-parametric sequences of the given system. It is more helpful in
the detection of multiple point change that occurs in the time series from the
unknown distribution. This method can be applied for the data streams where
only one observation can be made. A special case of CPM method requires that
the detection points should be displayed. For each detection process, we store
the values of the corresponding number of logins.
This
type of detection process makes use of two types of parameters, where one parameter
is related to the testing of statistic value and the second parameter is the
number of observations that are made at the beginning of the process and until
the change occurred in the points. The test statistic value offers multiple
versions to detect the changes depending on the type of distribution. They have
the ability to quantify or measure the delay but unfortunately, this CPM is no
longer used in the CRAN process.
BCP:
This
package is used for performing the Bayesian analysis of change points in
problems. This is an R package that was designed using the Markov chain
Carlo to find the multiple changes in point that occurs within the sequential
analysis. This package is restricted to the implementation of multivariate
case.
The
BCP approach uses three types of parameters. One of the parameter is the
probability threshold of the estimated probabilities.
ECP:
This
package is specially designed for the analysis of non-parametric multiple point
change in the multivariate data. The ECP package is similar to the hierarchical
or sequential process used in the EM Algorithm and offers the top-down
and bottom-up approach for the change point detection process. Usually,
the top-down approach is recommended for the Tableau where minimum number of
observations is required.
The
process involved in the change point detection is:
- First, when we perform the analysis, the analyst can make
use of the background knowledge about the data and the possible effects
from the external sources affecting the data. This kind of observation is
not easily gathered for the algorithm.
- Second, this is the process that takes place before the final
step. This process mainly focuses on the less complex decision making
technique.
- The third and the final process involves the submission of the visual feedback that demonstrates how these algorithms perform and give the results by providing a second opinion.

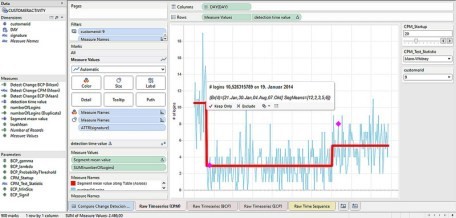
Fig. 1- The Dashboard Representation
The above dashboard represents a very simple structure that shows the trial- and- error and experimental observations, rather than theoretical observations that are made using the packages discussed above. There are various options like signature, and the parameters are held on the right side of the dashboard that allow to interact with the algorithm and in understanding the data and in the filtering process. The following advancement or progress can be followed in the working of dashboard:
- Loading of packages and
initialization of various parameters
- Triggering the change point
detection
- Extraction of exact location of
the change points by applying the filtering process
- Calculating the segment value
of the mean value identified in the change point.
Change Point Analysis
Change-point analysis is one such tool that is used for determining whether the change has taken place or not. It is also capable of finding the changes that have been missed while estimating the control chart. Change-point analysis has the ability to study how a process changes over time as it is an effective way in determining the historical data and in dealing with the large amount of data. It provides the control over the overall error rate and is more flexible and a simpler method to be implemented.
Multiple changes can be found by the change point analysis and detailed information is extracted that can be used for the future purpose. This analysis can be performed for all types of time ordered data such as attributed data, abnormal distributions and discrete or distinct data which does not fall in the required set of data. The change point control is similar to the traditional control chart method and the major difference between the change point analysis and control charting is that the control charts are to be updated for each and every collection of point, while the change point analysis is performed for the data that is collected for the first time.
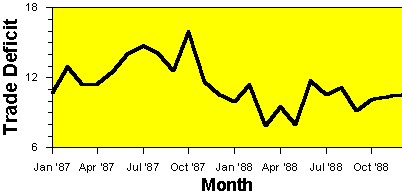
Control charts are better at detecting the abnormal points more quickly while change point analysis is used to detect the changes that are missed in the control charts. This method is applicable for the system with thousands of data points along with the numerous points. Let us consider the US trade deficits during 1987-1988 as the example for the change point analysis.
Jan
Feb
Mar
Apr
May
Jun
Jul
Aug
Sep
Oct
Nov
Dec
1987
10.7
13.0
11.4
11.5
12.5
14.1
14.8
14.1
12.6
16.0
11.7
10.6
1988
10.0
11.4
7.9
9.5
8.0
11.8
10.5
11.2
9.2
10.1
10.4
10.5
 Fig. 2- Plot for the US deficit dataThe trade deficit plot shows to be in lower rate in 1988 than in 1987. There are various approaches followed for performing the analysis. Both control chart and change point model were applied for this process. However, the control chart detected the change barely. But, the change point analysis provided additional information other than the control chart. The procedure suggested by Taylor is used along with combination of cumulative sum chart and with bootstrapping or resampling method for the detection of the changes. Practice is required for the implementation of the CUSUM procedure.
Fig.3- Change point analysis
For the change point analysis, excel implementation purpose, the excel add-in software is used and the change point analyzer is used for this purpose.
Advantages of Change Point
Some of the features of change point analysis are as follows:
- This analysis is more powerful
in detecting the small as well as changes that are sustained or maintained
over a long period of time.
- It reduces the possibility of
false or erroneous detections by implementing the control of change in
error rate while, control charts use point wise error rate for large data
that produces more false detections.
- It provides a better approach
towards the abnormal data.
- This type of analysis is more
flexible. The analysis is based on the single assumption method only.
- The method is simpler and easy
to use and to be interpreted. It has the ability to automate the difficult
process.
ApplicationsThe change detection test is useful and better suited in the manufacturing of equipment that aid in the quality control and in the detection of intrusion, filtering of spam, tracking of websites and in the diagnosis of medical aids. The change point detection is more helpful in the field of simulation process and in designing the filters for the digital signal processing.
More Readings
- Loading of packages and
initialization of various parameters


 USA
USA  India
India